Las Vegas roads remain among the deadliest in Nevada, and 2025 numbers confirm the trend. By August 21, the Las Vegas Metropolitan Police Department (LVMPD) had recorded 106 traffic fatalities, already surpassing the 87 deaths reported by the same date in 2024. This rise underscores how quickly roadway risks are escalating across the city.
The problem extends beyond the overall fatality count. News 3 Las Vegas (KSNV) reported a 123% increase in failure-to-yield crashes, with related deaths climbing from 13 in 2024 to 29 in 2025. Each case reflects more than a statistic; it represents families coping with tragedy and survivors left with lasting injuries.
Statewide data from the Nevada Department of Transportation (NDOT) shows Las Vegas consistently accounts for most of Nevada’s roadway deaths, raising urgent questions about safety, liability, and accountability on local streets.
If you’ve been affected by a car crash, call Ace Law Group at (702) 333-4223 for a free consultation.
Las Vegas Car Accident Data 2025: Key Trends and Local Risks
- 106 roadway deaths recorded by August, exceeding the same period in 2024.
- More than 20,000 annual crashes, averaging 56 incidents per day across the city.
- Failure-to-yield collisions surged, making them the top fatal crash cause.
- Hit-and-run cases rose sharply, while DUI-related deaths declined by half.
- Charleston Blvd & Rainbow Blvd remained the most dangerous intersection, with pedestrians and motorcyclists facing the greatest fatality risk.
How Many Car Accidents Happen in Las Vegas Annually?
Las Vegas records more than 20,000 reported traffic accidents each year, representing about 43% of Nevada’s total crashes. This concentration reflects the city’s heavy tourism, dense population, and high-speed corridors, making Las Vegas the most collision-prone metro area in the state. The data below illustrates the historical evolution of crash volumes, drawn from official records.
Las Vegas/Nevada Total Reported Crashes (2021–2025)
Fatal crashes in Las Vegas have risen steadily over the past four years, underscoring persistent dangers on city streets. While overall crash numbers remain high, roadway deaths reflect how human error and urban congestion turn routine incidents into tragedies.
| Year | Reported Crashes | Total fatal crashes (Las Vegas) | Total fatal crashes (Nevada) |
|---|---|---|---|
| 2021 | 20,324 | Not stated | 385 |
| 2022 | 19,891 | 148 | 416 |
| 2023 | Not stated | Not stated | 406 |
| 2024 | Not stated | Not stated | 421 |
| 2025* | Not stated | 155 | 162 |
**Preliminary data as of May 2025. Figures include everything from minor fender benders to fatal collisions.
Source: Zero Fatalities Nevada
Daily and Monthly Crash Averages
Las Vegas reports about 56 crashes per day, equaling 1,700 – 1,850 per month. With more than 20,000 annual crashes, 2025 projections already suggest totals may exceed 22,000 accidents, driven by tourism surges, event traffic, and summer roadway conditions.
Urban vs. Highway Zones
NDOT analysis shows nearly 9 out of 10 fatal crashes in Nevada occur in urban zones, with Las Vegas at the center of that risk. Pedestrian exposure, dense intersections, and failure-to-yield violations dominate city fatalities, while rural highways account for a smaller share but involve higher speeds and deadlier impacts.
If you’re caught in one of these collisions, contact Ace Law Group to get timely legal support from our experienced attorneys for Las Vegas car accident claims.
What Percentage of Accidents in Las Vegas Involve Drunk Driving?
Drunk driving continues to play a major role in Las Vegas roadway deaths and injuries. State and national data confirm alcohol-impaired driving remains one of the most common causes of fatal collisions, despite tougher enforcement and public awareness campaigns.
- Statewide impact: In 2023, 34% of Nevada’s fatal crashes involved drunk drivers (IIHS).
- Injury crashes: Alcohol factored into 18-20% of injury collisions that year.
- National comparison: The NHTSA reports 32% of U.S. fatal crashes involve a drunk driver.
- Local enforcement: DUI checkpoints are heavily concentrated near the Strip, Fremont Street, and resort corridors, where late-night crashes are most common.
- BAC limits: Nevada law sets a 0.08% blood alcohol concentration (BAC) limit for drivers, with stricter standards for commercial operators and underage drivers.
- Legal perspective: Drunk driving accidents often create clear liability, but insurance disputes and damage calculations can complicate claims. Victims in Las Vegas frequently turn to experienced counsel like Ace Law Group to pursue full compensation.
Which Las Vegas Intersections Have the Most Car Crashes?
National Highway Traffic Safety Administration (NHTSA) data show 36% of U.S. crashes occur at intersections, and Las Vegas follows the same pattern. Between 2024 and mid-2025, several Las Vegas intersections repeatedly ranked as the city’s most hazardous, reflecting a mix of congestion, poor road design, and unpredictable driver behavior.
Top 5 Crash-Prone Locations (2024–2025)
LVMPD reports identify these intersections as the most collision-prone in Las Vegas:
| Rank | Intersection | Primary Risk Factors |
|---|---|---|
| 1 | Charleston Blvd & Rainbow Blvd | Congestion, frequent lane changes, high rear-end and side-impact crashes |
| 2 | Tropicana Ave & Rainbow Blvd | High-speed corridor, mixed tourist/commuter traffic, sudden lane shifts |
| 3 | Flamingo Rd & Rainbow Blvd | Dense residential/retail zone, pedestrian conflicts, frequent turning |
| 4 | Sahara Ave & Decatur Blvd | Multiple bus stops, stop-and-go traffic, aggressive merging |
| 5 | Sahara Ave & Valley View Blvd | Industrial traffic, wide truck turns, poor lane clarity |
These intersections illustrate how recurring traffic behaviors and poor roadway features amplify crash frequency in high-density zones.
Traffic Volume and Road Design Challenges
Crash concentrations at these intersections stem from overlapping design flaws and heavy traffic demand. The main contributors include:
- Multiple lane merges in short distances
- Insufficient left-turn signal timing
- Poor nighttime visibility in key corridors
When Do Most Car Accidents Occur in Las Vegas?
Las Vegas crash timing reflects the city’s 24-hour lifestyle rather than standard commuter peaks. While rush-hour traffic remains dangerous, late nights and weekends bring a higher share of severe and fatal collisions, often linked to DUI and tourist activity.
Hour-by-Hour Collision Trends
Crash data highlights clear daily risk patterns:
- Afternoon rush (3 PM – 7 PM) sees the highest collision volume, driven by commuting and school traffic.
- Late-night hours (10 PM – 2 AM) show elevated fatalities tied to DUI, fatigue, and Strip congestion.
- Early morning (2 AM – 6 AM) records fewer crashes, but those that occur are often severe due to impaired or drowsy driving.
Seasonal and Weekend Spikes
Accident frequency rises in summer and on weekends, when both traffic and temperatures climb.
- June through August show 8-12% more crashes than annual averages.
- Weekends (Friday-Sunday) account for nearly 45% of weekly collisions.
- Triple-digit heat contributes to tire blowout accidents and overheating, leading to sudden roadway emergencies.
Holiday and Tourist Traffic Impact
Holiday periods and major Las Vegas events consistently elevate crash risk.
- Collisions spike on New Year’s Eve, Fourth of July, Thanksgiving, and Christmas weekends.
- Large events such as the F1 Las Vegas Grand Prix, CES, and UFC fights bring heavier pedestrian flow, temporary road closures, and increased DUI arrests.
- The Strip and downtown corridors see the highest concentration of these event-related incidents.
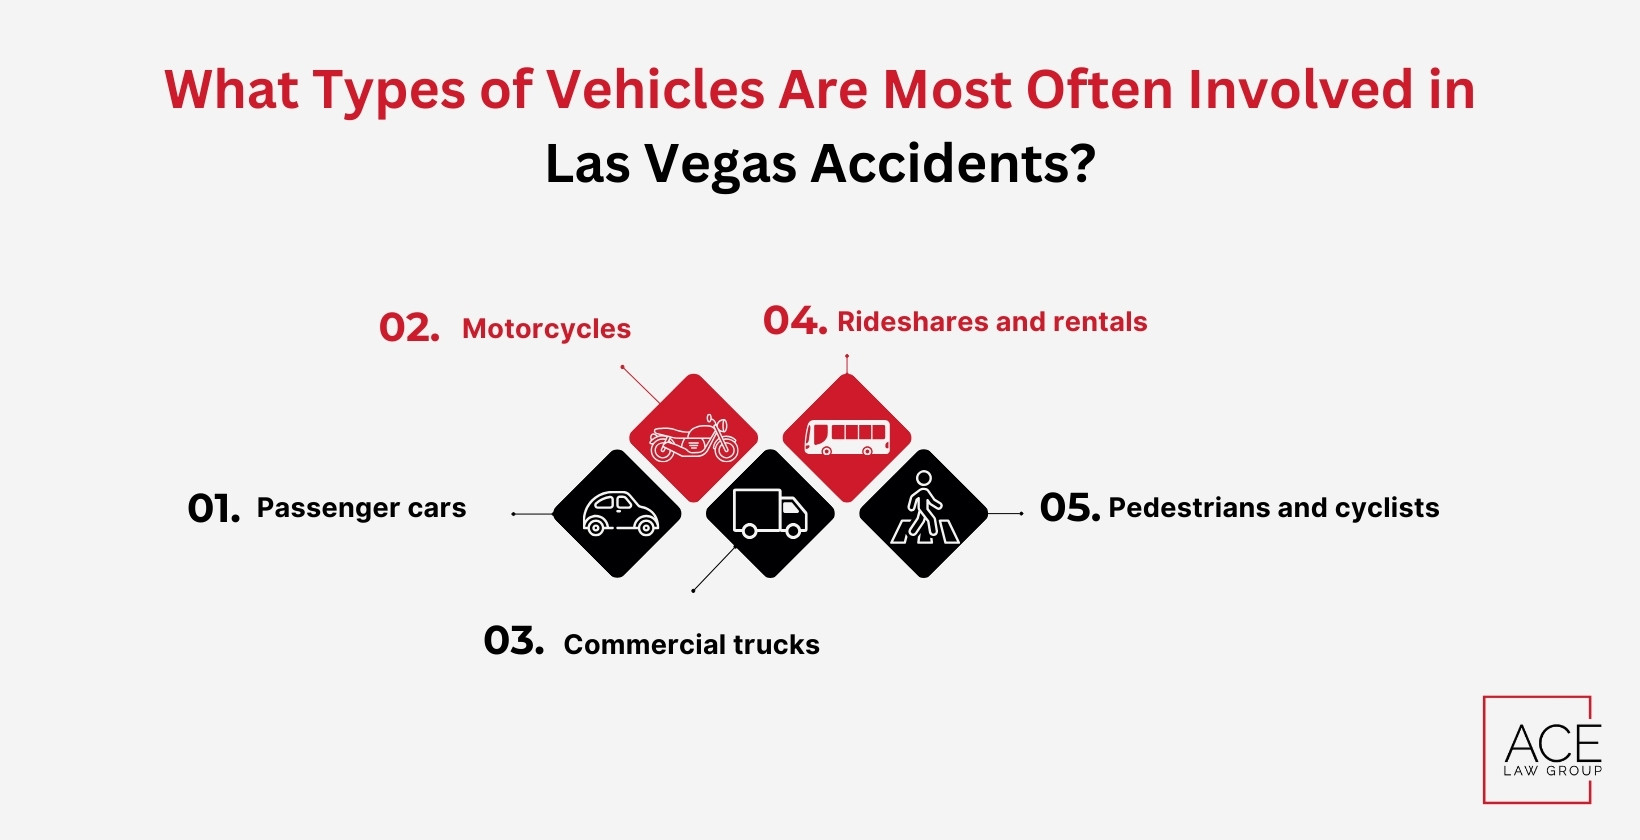
What Types of Vehicles Are Most Often Involved in Las Vegas Accidents?
Crash involvement varies widely by vehicle type, with some road users facing greater risks of fatal injury than others:
- Passenger cars: Over 80% of reported crashes, but only a moderate share of fatalities.
- Motorcycles: About 3% of crashes, yet linked to a disproportionately high number of deadly outcomes.
- Commercial trucks: Roughly 5% of incidents, often involving severe injuries due to size and impact force.
- Rideshares and rentals: Uber, Lyft, and shuttle buses cluster near resorts and the airport; rental cars are 16% more likely to involve out-of-state drivers.
- Pedestrians and cyclists: Among the most vulnerable. Mid-2025 data shows 21 pedestrian fatalities, down from 28 in the same period of 2024. Most incidents occur at night, worsened by jaywalking, poor lighting, or distracted driving.
Las Vegas Car Accident Rates Compared to Other Major U.S. Cities
Las Vegas accounts for more than 43% of Nevada’s crashes, making it disproportionately dangerous compared to many larger states and cities. NDOT and national data show that Nevada’s fatality rates align more closely with high-risk states like Texas, while far exceeding urban areas such as New York.
| Statistic | Nevada | California | Texas | New York |
|---|---|---|---|---|
| Total Deaths | 389 | 4,061 | 4,291 | 1,114 |
| Deaths per 100,000 Population | 12.2 | 10.4 | 14.1 | 5.7 |
| Deaths per 100 Million Vehicle Miles Traveled | 1.40 | 1.28 | 1.43 | 0.93 |
These comparisons highlight how Las Vegas drivers face risks that resemble sprawling states like Texas, rather than dense metro areas such as New York City.
Who Is Most at Risk in Las Vegas Car Accidents?
Certain groups face a significantly higher risk of injury or death on Las Vegas roads:
- Pedestrians: Often struck due to crosswalk violations, poor lighting, and distracted drivers.
- Motorcyclists: Vulnerable because of low visibility, high speeds, and inconsistent helmet use.
- Drivers ages 15-35: Overrepresented in crashes tied to speeding, DUI, and phone use.
- Cyclists: Limited bike lanes and low driver awareness increase collision frequency.
- Tourists: Higher accident risk linked to road unfamiliarity and elevated rental car crash rates.
- Graveyard shift workers: Nighttime driving raises exposure to fatigued and impaired motorists.
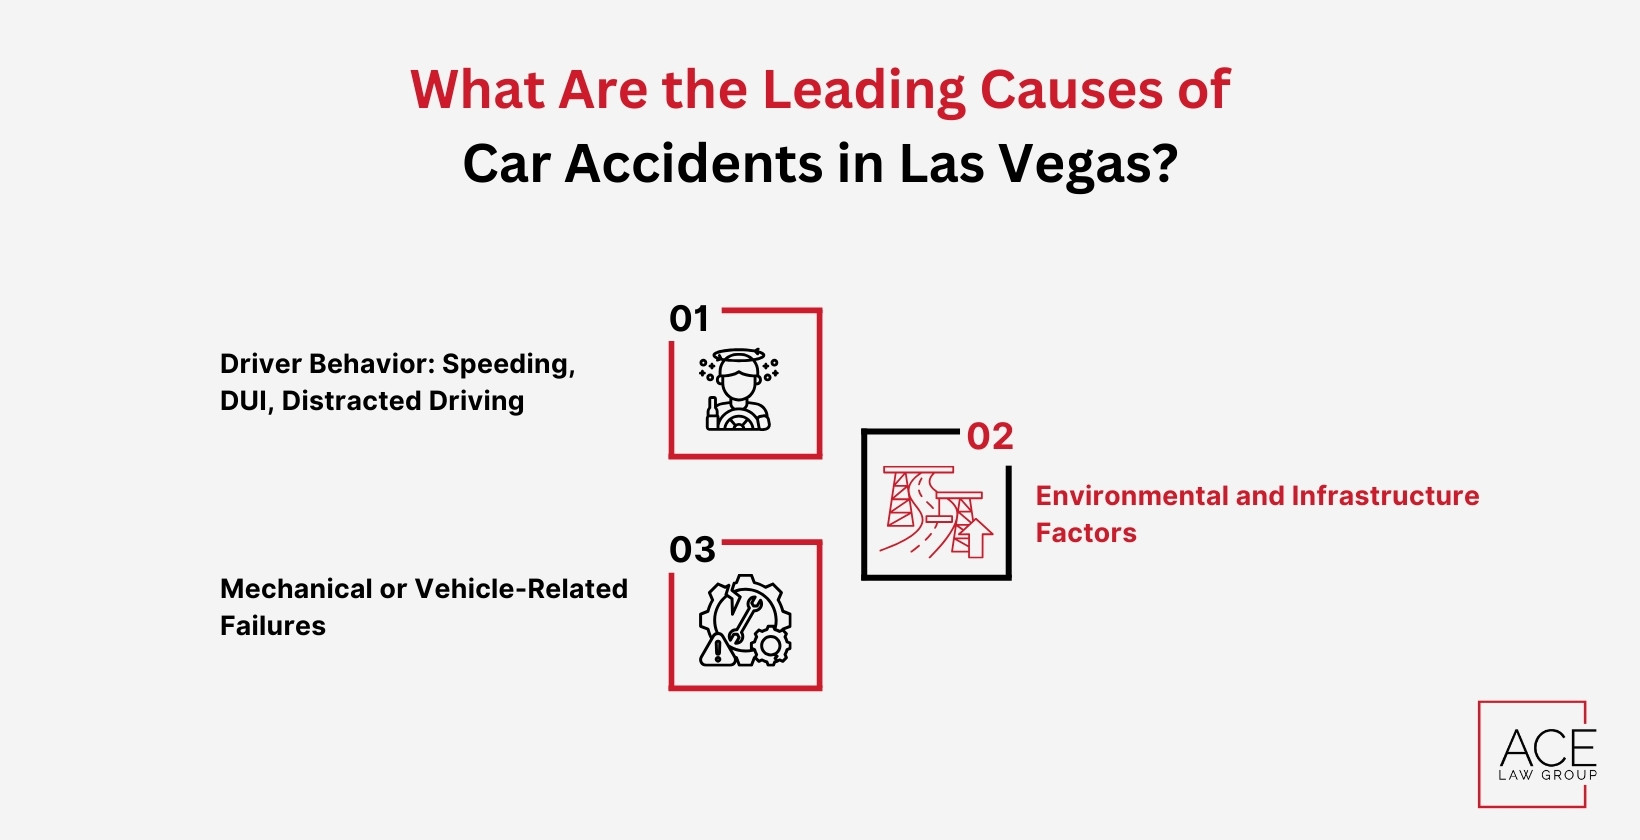
What Are the Leading Causes of Car Accidents in Las Vegas?
Las Vegas crash data shows most collisions stem from human error, with violations like speeding, distracted driving, and failure to yield, driving fatality spikes in 2025. While DUI-related deaths have declined, other risky behaviors are creating new patterns of danger and liability on city roads.
Driver Behavior: Speeding, DUI, Distracted Driving
Over 90% of crashes in Las Vegas are linked to unlawful driver behavior. The most common contributing factors are:
- Speeding caused 20 traffic fatalities in 2024, marking a 10% increase from 2023.
- Distracted driving was present in 13% of all police-reported crashes in 2021.
- DUI fatalities declined in 2025, yet impaired driving continues to account for serious injuries and wrongful deaths.
Environmental and Infrastructure Factors
Road design and conditions also influence crash risk. Poor lighting at intersections, narrowed lanes in construction zones, and high-speed corridors like I-15 or Sahara Avenue create hazards that increase both accident frequency and injury severity, especially for pedestrians and out-of-state drivers unfamiliar with dangerous roads in the Las Vegas area.
Mechanical or Vehicle-Related Failures
Mechanical failures account for less than 2% of crashes but often lead to catastrophic outcomes. Tire blowouts, brake failures, or steering malfunctions cause sudden loss of control, frequently resulting in rollovers or multi-vehicle collisions where liability may extend to vehicle manufacturers or fleet operators
What Are the Most Common Injuries from Las Vegas Car Crashes?
Crash injuries in Las Vegas range from minor wounds to catastrophic trauma. Commonly reported car accident injuries include:
- Fractures (arms, legs, ribs): Caused by impact or seatbelt force; recovery takes 6-12 weeks, longer with surgery.
- Traumatic Brain Injury (TBI): Results from head impact; recovery may take months or last permanently.
- Whiplash/Neck strain: Rapid back-and-forth motion damages soft tissue; recovery averages 2-8 weeks.
- Spinal cord injury: Damage to discs or vertebrae, sometimes leading to paralysis; recovery may last months or be lifelong.
- Internal organ damage: Blunt trauma causing internal bleeding or rupture; requires immediate surgery.
- Emotional trauma/PTSD: Crash survivors often face anxiety or flashbacks; recovery varies from weeks to years.
- Cuts, lacerations, bruising: Typically from glass or airbags; healing time is 1-3 weeks.
- Burns (fire-related crashes): Caused by vehicle fires or chemicals; recovery takes weeks to months.
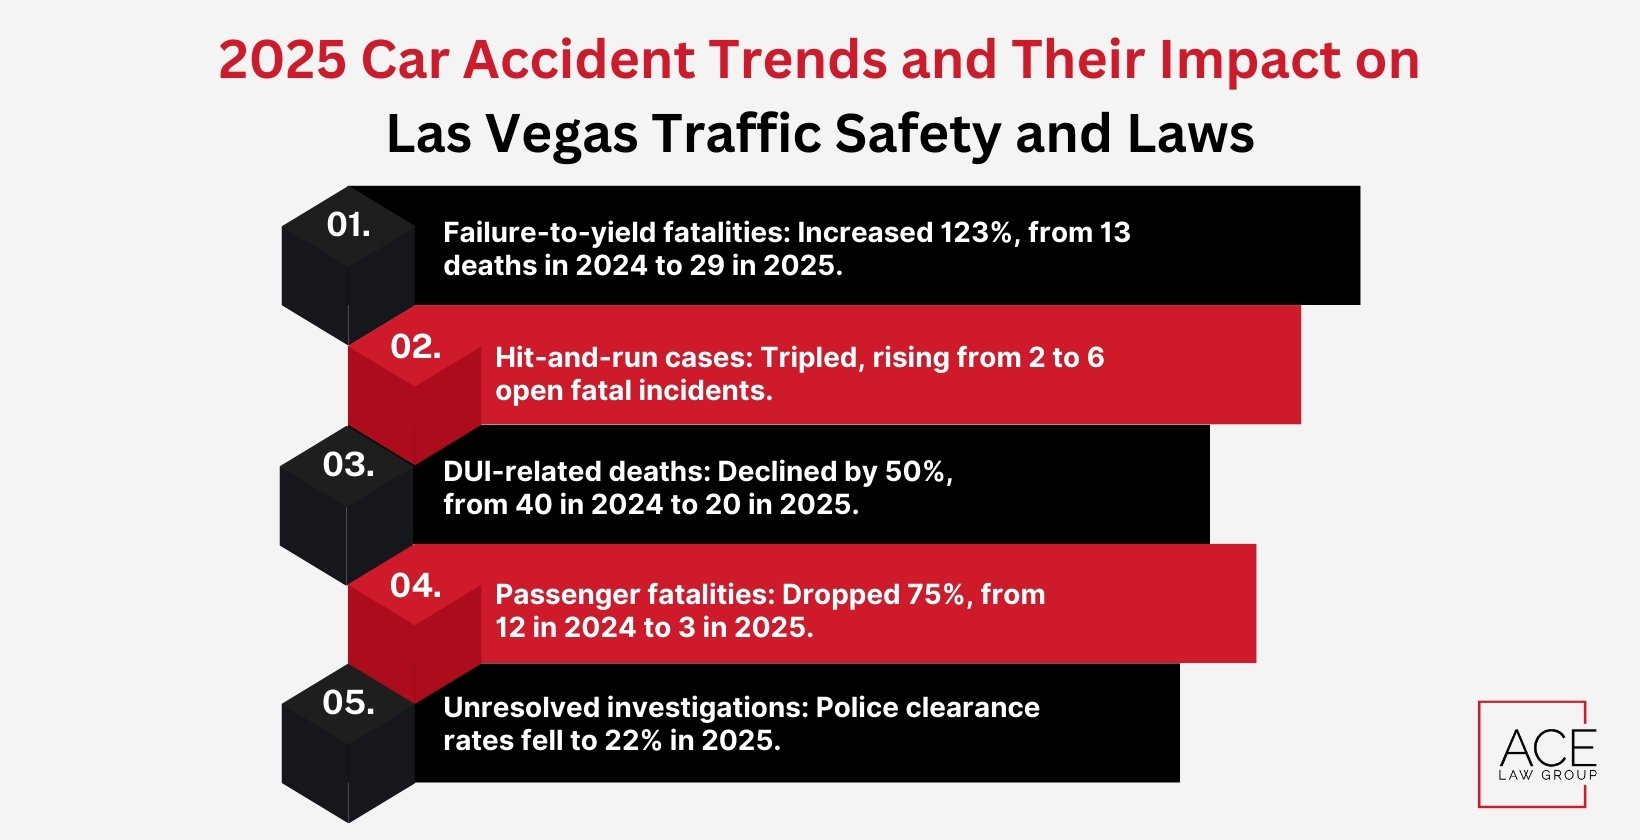
2025 Car Accident Trends and Their Impact on Las Vegas Traffic Safety and Laws
Crash data from 2025 highlights shifts in both fatality patterns and legal accountability. These trends reveal how liability may be reassessed in future claims:
- Failure-to-yield fatalities: Increased 123%, from 13 deaths in 2024 to 29 in 2025.
- Hit-and-run cases: Tripled, rising from 2 to 6 open fatal incidents.
- DUI-related deaths: Declined by 50%, from 40 in 2024 to 20 in 2025.
- Passenger fatalities: Dropped 75%, from 12 in 2024 to 3 in 2025.
- Unresolved investigations: Police clearance rates fell to 22% in 2025.
These shifts may broaden liability beyond drivers, exposing municipalities, fleet operators, or third parties to claims. Navigating such cases often requires guidance from an experienced Las Vegas car accident lawyer.
How to Choose a Qualified Car Accident Lawyer in Las Vegas?
Selecting the right lawyer after a serious crash can determine the outcome of your case. A qualified attorney brings proven experience, knowledge of Nevada law, and the ability to maximize compensation in complex car accident claims. If you’re wondering What Does a Car Accident Lawyer Do in Las Vegas?, know that they manage all legal steps from investigation to negotiation or trial. Key factors to evaluate include:
- Credentials: Active Nevada Bar license, professional recognition, and trial readiness.
- Case experience: Proven results in car accident litigation, including wrongful death and catastrophic injury cases.
- Local expertise: Familiarity with Las Vegas courts, judges, and accident patterns unique to tourist-heavy areas.
- Consultation questions: Ask about success rates, approach to settlement vs. trial, and how evidence will be collected and preserved.
- Expert recommendations: Legal specialists emphasize choosing firms with resources to handle severe injury cases. For example, Ace Law Group is often cited in Las Vegas for its focus on high-stakes personal injury litigation.
A strong lawyer provides not only representation but also strategic guidance to help injured victims pursue fair compensation. But if you are still confused about when to hire a lawyer, read our full blog titled “When to Hire a Car Accident Lawyer in Las Vegas, Nevada?“
FAQs About Reckless and Aggressive Driving
Can you file an accident claim without a police report in Nevada?
Yes, you can file an accident claim without a police report in Nevada. A police report strengthens evidence, but Nevada law requires only a DMV crash report within 10 days if injuries, fatalities, or property damage occurred.
If you are unsure how to prepare a police report, we have a guide on How to Get Access to a Car Accident Report in Las Vegas for you.
How do tourist accidents impact insurance claims?
Tourist accidents often involve rental cars and out-of-state policies. Insurance claims in these cases become more complex due to differing liability limits and unfamiliar state insurance requirements.
What’s the average time to resolve a car accident case in Las Vegas?
A typical car accident case takes an average of 3-9 months, but severe injuries or disputed liability can extend resolution time to 12-18 months or more.
CDo pedestrian accidents require a different legal process?
Yes, pedestrian accidents require a different legal process in Nevada. Pedestrian liability is defined under NRS 484B.287, and higher injury severity often changes how medical records, property damages, and negligence are evaluated compared to vehicle-only accidents.
How can I get an official Las Vegas crash report?
To get an official Las Vegas crash report, the LVMPD provides three methods: online request, in-person visit, or U.S. mail. Reports generally become available within 10 business days after being filed.
Using 2025 Crash Statistics to Protect Your Rights in Las Vegas
The 2025 crash data makes one fact clear: Las Vegas roads remain among the most dangerous in the nation, with rising failure-to-yield deaths, hit-and-runs, and risks for pedestrians and tourists. These patterns show how quickly a routine drive can turn life-changing.
If you or a loved one has been injured in one of these crashes, protecting your rights requires timely action. Call Ace Law Group at (702) 333-4223 or use our FREE consultation form to discuss your case with an experienced Las Vegas car accident lawyer.